How to Understand Your Website Analytics
So, you’ve set up your Squarespace website or blog and now you’re wondering…
How’s it doing? Is anyone visiting it? What are they reading?
Understanding your website analytics is a key element of growing both your website and your business overall.
A quick look at your analytics report can give insight into your audience—who they are, where they’re coming from, what content they’re interested in, and how they behave on your website—so you can learn more about them and then use that information to serve them better.
This basic overview of website analytics will walk you through the most important metrics to pay attention to as a small business owner or entrepreneur, and give tips for using this information to tailor your website content to:
assist in growing your website traffic
and convert your website visitors into paying customers or clients
While I’ll focus specifically on the built-in Squarespace Analytics dashboard (Squarespace is by far my favorite website platform to build on!), these terms and tips can also be applied to other analytics reporting tools as well (like Google Analytics).
This post contains affiliate links through which I may earn a commission if you choose to purchase, at no additional cost to you. As always, these are products or services I personally use & love!
Squarespace Analytics vs. Google Analytics
While there are many tools available for measuring and providing insights on website analytics, Google Analytics is pretty solidly the king of website analytics reporting. It’s a robust and highly customizable tool that can produce a huge range of specific reports, based on your website and business needs.
However, Google Analytics is also quite a bit more complicated to set up and learn to use than your built-in Squarespace Analytics dashboard.
Squarespace Analytics is usually quite sufficient for most website owners and also has the added benefit that it comes all set up and ready to go! No need to build the reports you’d like to see—they’re already waiting for you in the back-end of your site.
(Google Analytics requires some set up from you to get going, and you’ll need to connect it to your Squarespace website to see data from it.)
Understanding your Squarespace analytics
Your Squarespace Analytics panel will vary a little based on the plan you’re on (the Business plan and Commerce plans have some additional reporting features).
We’ll focus on the Squarespace Business plan features, as that’s the one most small business websites are built on, and contains the key analytics most businesses and bloggers need to track across various industries.
(If you’re unsure, here’s how to choose the right Squarespace plan for your website.)
Here are the top metrics I recommend monitoring in your Squarespace Analytics panel, so you can use their data to improve your website content and performance (to ultimately grow your business and brand!).
You’ll want to regularly keep an eye on these website metrics:
1. Traffic
The first report you’ll see when opening your Squarespace Analytics panel is your general website traffic—how many people are visiting your website. Here you’ll see a few measures:
Unique visitors: how many people have visited your site during the timeframe reported
Visits: how many browsing sessions occurred on your site during this time (browsing sessions are measured in a 30-minute window)
Pageviews: how many total pages have been viewed on your site during this time
Note that you can change the timeframe of your report with the dropdown menus on the right side of your screen. We typically look at the last 30 days’ traffic, though it can also be helpful to see snapshots of other timeframes as well, depending on the specific insights you’re looking to glean.
We’ll dive into some more details on understanding your traffic below, but this segment of your report gives a quick overview of your overall website traffic, and how it’s performing in comparison to the previous period (with the green or red month-over-month percent change figures).
Though there’s no “golden number” of website visitors or page views you should be aiming for (that, of course, varies widely across industry, business type and how established you are—and we’re aiming for quality more so than quantity of traffic), it’s helpful to monitor how your website is performing against its own past performance.
You can see below that this example site is experiencing positive growth month-over-month and has a couple peak traffic days that could be explored more:

You may notice in the example above that Unique Visitors is higher than Visits—how can that be? (How can you have more visitors than visits made by them? 🤔)
This can happen because only the first pageview of a new browsing session counts toward the Visit measure. So, a single visit that straddles the midnight boundary could contribute to the next day’s Unique Visitors, but not Visits.
How to use traffic data to improve your website
Understanding your website’s general traffic trends can help to inform possible changes that can improve your website’s overall performance (aka attract more visitors, and keep them on your website longer, accessing more of your content).
For example, is there a certain day of the week you routinely have more website visitors than other days of the week? That may be a good day to post new content. Are there certain days of the week you see consistently lower website traffic? Those might be good days to perform site updates, if needed.
And, how is your traffic trending over time? Can you note where growth might be impacted by campaigns or promotions you’ve run, or changes you’ve made to your website?
2. Traffic sources
The Traffic Sources report will show how much of your website traffic comes from different sources—or, in other words, how people are finding out about your website.
The primary traffic sources you’ll see are:
Direct: when someone types your URL directly into their browser
Social: traffic that comes to your site via social networks like Facebook, Twitter, Pinterest, Instagram, LinkedIn and YouTube
Email: traffic from your email marketing campaigns
Referral: visitors that come to your website from another website or blog
Search: organic traffic from Google and other search engines
There are also a few other sources you may see (though they’re less common for new websites/blogs):
Display Ads: traffic from ads displayed on other websites
Paid Search: traffic from paid advertisements on Google and other search engines
Note that your Squarespace Analytics panel will only list the traffic sources from channels that are active in your current report (for example, if you did not receive any Paid Search traffic in the month that you’re viewing, you will not see that traffic source shown in your report; though it may be shown if you change the timeframe viewed).
Understanding your traffic sources is useful for getting to know where your audience is coming from (aka where they’re “hanging out”). This information can help guide your future marketing strategies, including the best potential placement for paid advertising.
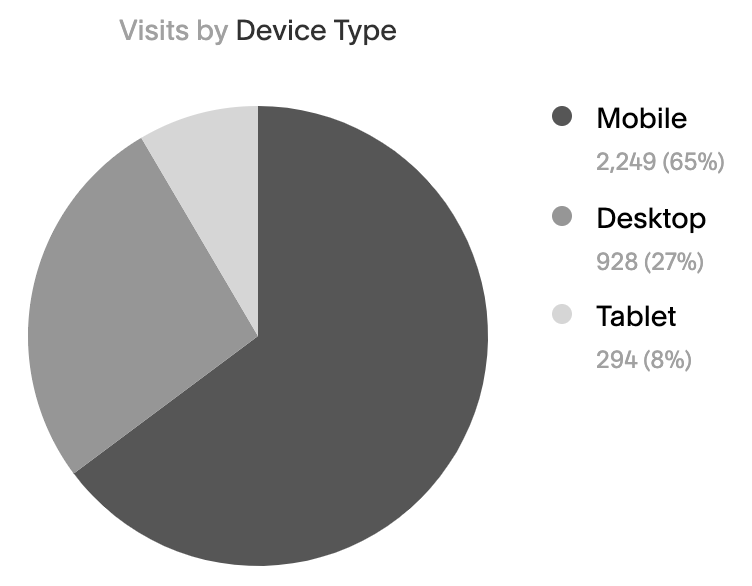
3. Visits by device type
You’ll find the Visits by Device Type metric under Traffic Overview—just scroll to the bottom of the report, underneath the general traffic graph. Here you’ll see a pie chart denoting the percentage of your website visitors who view your site on desktop, mobile or tablet.
These stats are useful in web design as they’ll clue you into specific strategies that may work better for desktop or mobile users.
For example, if you have a large percentage of mobile users, you’ll want to pay special attention to ensuring your website is mobile-friendly. This may require specific design strategies, like increased font size, as well as content strategies, like smaller paragraphs.
You can see that, for the example site below, 73% of visits occur on mobile devices, so they’ll definitely want to focus on their mobile-friendly design strategies!
4. Popular content
The Popular Content metric details engagement on the various pages across your site, measured in page views.
Reviewing your popular content helps to understand both a) which content is reaching and resonating with your website visitors and b) which content is not reaching or resonating with them as intended.
For blogs in particular, I recommend monitoring both your top performing blog posts, as well as your lowest performing blog posts and looking into potential reasons for that.
Are your best performing posts longer and more detailed, while your lowest performing posts are more brief? That’s a good clue into the post length your audience finds useful and would like to see more of. Or, have your best performing posts been promoted on Pinterest and your lowest performing posts have not been? That’s another useful insight into how promoting your posts affects the growth of your blog post traffic.
Look for trends among your best performing content and your lowest performing content and adjust your strategies to focus more on what works well—and shift away from what’s not bringing results.
5. Form & button conversions
Your Form & Button Conversions report is one of the most useful metrics in your Analytics panel if you’re looking to grow your mailing list or other specific business actions. Scroll down to the Form Details, where you’ll see the total views, submissions and conversion rate for each form or button.
Your conversion rate lets you know how each form or button is performing—when website visitors come upon it, how likely are they to take the action you’re asking them to take?
Average conversion rates vary widely based on industry, type of opt-in, and placement on the page. But, just as an example and reference point, the average conversion rate for a website pop-up is about 3%.
Tip: If you have multiple forms leading to the same action, it’s a good idea to structure their internal label so you can easily differentiate them in your Squarespace Analytics panel. For example, instead of labeling each newsletter sign-up form as simply “Newsletter Form,” it’s best to choose something more descriptive, such as “Newsletter: [Blog Post Title]” (see the example below), which will help you easily differentiate your form sources in this analytics report—and that gives you a better snapshot of the different conversion rates across different pages on your site.

6. Google search keywords
Understanding your top Google Search Keywords (the top phrases or keywords that have connected Google search queries with your website content) can help better understand your website visitors, what they’re interested in, and the specific language they’re using to search for that content (so you can create more content that aligns with those needs!).
Making use of these keywords in your website copywriting can also help improve your website’s overall SEO, as you’re better aligning your content with the keywords your audience is actually searching for.
Here are a few quick definitions of the terms you’ll see in your Google Search Keywords report:
Clicks: The number of clicks for the particular keyword(s) that brought users to your website
Impressions: The number of people who “saw” your website appear in their search results (though this does include instances in which your link was not scrolled into view)
Click rate: The rate at which people seeing your link in Google search results clicked on it (clicks divided by impressions)
Average position: The average position of the top-most result from your website in Google search queries
Here’s an example from my own website, showing a particular keyword, the page it links to on my website, and its performance data over the “last 30 days” timeframe:

I got lucky with this one, as you can see it’s performing at the top of Google search results for this query—its average position is 1.03, meaning it’s often the first result for this particular search keyword. (In general, you’ll want to be aiming to get this number as close to 1 as possible.)
Note that, like this example, your search keywords will often be long-tail keywords made up of a string of words people actually search together—in this case, “Squarespace membership site.”
So, I can monitor information from this page and understand that my website visitors are interested in knowing about Squarespace membership sites—and then I can create more content for them on that topic area (oh, look, I did! 😉).
Though your numbers in your Google Search Keywords report may feel low if you’re just starting out with a new website, monitoring your top search keywords can help to build out your site with content that’s relevant to your audience—and thus improve your Google search impressions, click rate and average position in the future.
And, you can review your keywords data to determine where you have “opportunity” keywords—those that are doing well comparative to other content on your site, and might be a good fit for some extra attention to help move them up the search results rankings.
How to exclude internal traffic from your Squarespace Analytics
When viewing your website analytics, there’s a key type of data you typically want to not see in your report—and that’s any traffic coming from yourself or other team members (otherwise known as “internal traffic”).
Fortunately, Squarespace Analytics automatically ignores any site owner or contributor activity as long as you’re logged into your Squarespace account. This means that, as you’re working on your website, your activity is not affecting your Squarespace Analytics results.
However, if you’re viewing your website incognito (perhaps to test it out, which can be a good idea), Squarespace Analytics won’t recognize you as a site owner/contributor and thus will track your activity with the rest of your website visitors.
To fully exclude any traffic from your IP address (whether you’re logged into Squarespace or not), you’ll need to set up your Squarespace integration with Google Analytics and follow Google’s documentation on hiding internal traffic.

Improve SEO on your Squarespace website!
Grab my free checklist for boosting search engine visibility + ranking: